How a Faulty Meter Tripled Our Steam Reading
Steam use at our Central Dining Hall tripled in two years, and the meter had an airtight story for why. It was wrong. A whodunit about dead-end theories, two AI assistants arguing with each other, and the wrench that finally told the truth.
Steam use at our Central Dining Hall roughly tripled over two years. Not a seasonal blip, not a one month spike. A sustained climb that showed up on the utility bill and didn't have an obvious explanation attached to it.
The easy answer was the kitchen. More students, more meals, more steam for cooking and dishwashing, so the number should go up. That held up for about five minutes. When I pulled the trend data, the increase didn't track with dining volume at all. October and November were both significantly higher than you'd expect if this were about covers served, and those aren't exactly peak semester months for the dining hall. Whatever was driving this, it wasn't people eating more.
So we started working the problem the way you'd work any other one. Test a theory, let the data kill it or keep it, move to the next one. For this one, I brought an AI assistant into the process early, mostly as a second set of eyes on the trend data and a way to keep track of what we'd already ruled out. It's a decent research partner. It is not the one who gets to decide when a theory is dead. That's still on me and whoever's standing in the mechanical room.
Next up was a leaky solenoid valve somewhere in the steam distribution, letting steam bleed off constantly instead of just when it was needed. That one actually came from the AI, and it wasn't a bad guess given the pattern in the data. But if a solenoid valve is stuck open and dumping steam, you'd expect to see actual water coming out of a drain somewhere near it. I asked it directly: wouldn't there be visible water coming out the drain if there was a leaky solenoid? Nobody had seen that in the mechanical room. Theory dead.
We went through a handful of others the same way, some mine, some the AI's. Each one sounded plausible walking in, and each one got disproven the moment we checked it against real data or a real walkthrough of the mechanical room. That part of the process is not fun. You start to feel like you're chasing your own tail, and honestly there were a few days where the honest answer to "what do we do now" was "I don't know yet." That's the part nobody puts in the case study, but it's most of the actual work.
By the time we were a few dead ends in, I stopped trusting any single answer, AI or otherwise. So I started running the working theory past a second AI assistant, basically handing one's analysis to the other and asking it to poke holes in it. That back and forth is what finally pushed the conversation toward the condensate return piping instead of the steam side, since neither one could fully explain the spike pattern without something happening on the way back to the boiler. It didn't hand me the answer. It narrowed where to go look.
The thing that actually cracked it wasn't a data plot or a chat transcript. It was a physical test. We opened a valve in the condensate return line and watched what happened. Water came out onto the floor, live, in front of us, when it shouldn't have been there at all.
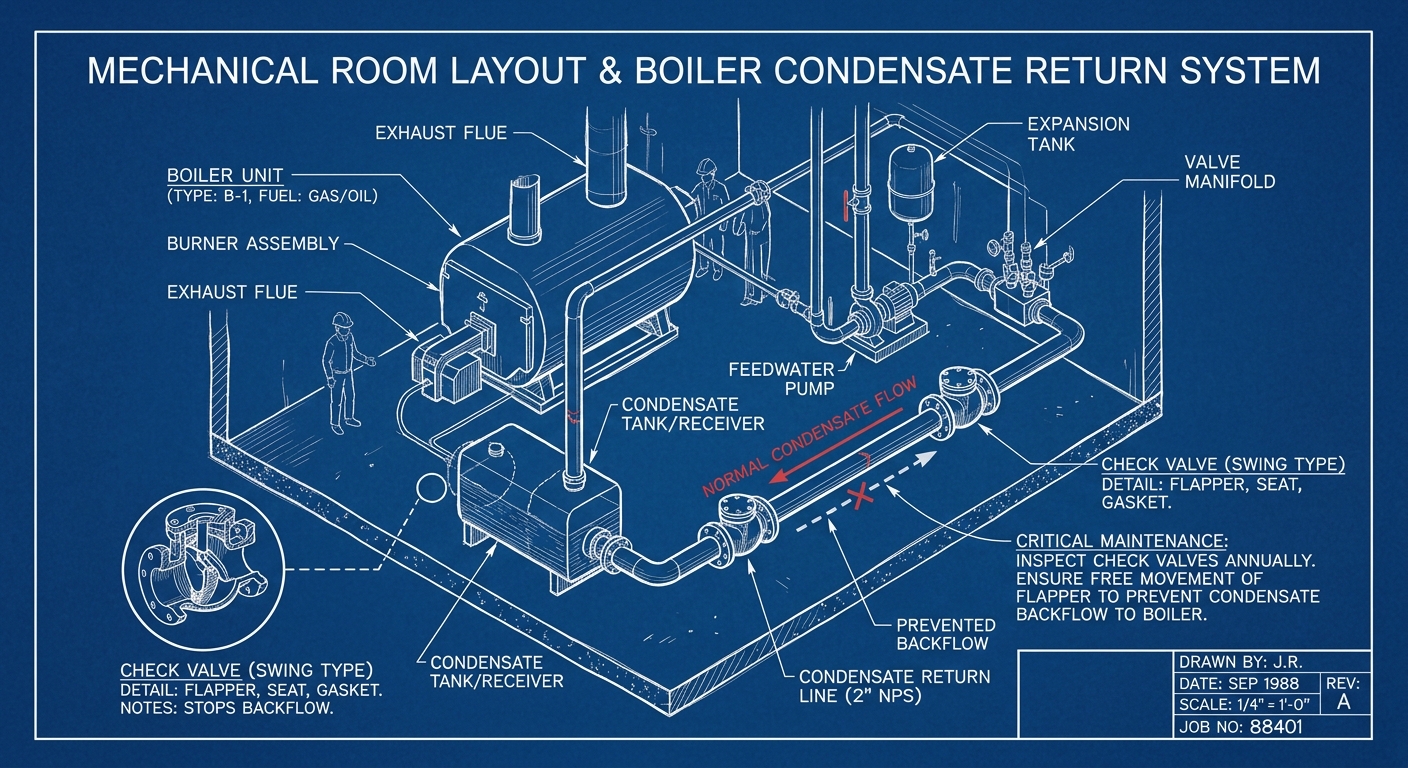
That sent us into the mechanical room to check the check valves, the one-way valves that are supposed to stop condensate from flowing backward once it's on its way back to the boiler. Two of them had failed. With those valves not sealing, condensate was flowing backward and getting pulled back through the meter a second time. The meter wasn't measuring steam use. It was measuring the same water twice, sometimes more.
Once we accounted for that, the numbers lined up. The meter had been reading 612 gallons an hour. A physics based estimate, working backward from boiler output and load, put actual usage closer to 178 gallons an hour. The meter had been overstating consumption by roughly 3.4 times. After the check valves were replaced, we had a simple way to confirm it: the condensate pump's cycle time went from about 5 minutes to 24 minutes. That's water actually leaving the system once instead of getting recirculated and re-measured.
None of the theories we killed along the way were dumb. They were the right things to check, in the right order, and ruling them out is what made the real answer trustworthy once we found it. If we'd stopped at the first plausible story, we'd have spent money chasing a kitchen efficiency problem that didn't exist.
If your steam or condensate numbers have crept up in a way that doesn't match building use, don't just trust the meter because it's new or because it's been calibrated once. Ask whether anything downstream of it, especially check valves and traps in the condensate return, could be sending the same water past the meter more than once. It's a cheap thing to check and an expensive thing to miss.
And if you're using an AI assistant to help chase down something like this, use it the way we did here: as a fast way to test theories and keep track of what's already been ruled out, not as the thing that gets the final word. It was useful for narrowing where to look. It was still a wrench and a valve, opened by a person, that told us what was actually true.
Jonathan runs energy for Appalachian State's campus and co-founded Ponytail Energy. He spends his days in trend data and mechanical rooms, chasing the quiet changes that show up on the utility bill before they show up anywhere else.